Back Test Mode
In Back Test Mode we can see how our Queries would have performed historically. Note - There was a break in racing from March 2020 until June 2020. Any results here are a guide ONLY.
Turn Back Test Mode on through the 'Back Test Mode' switch.
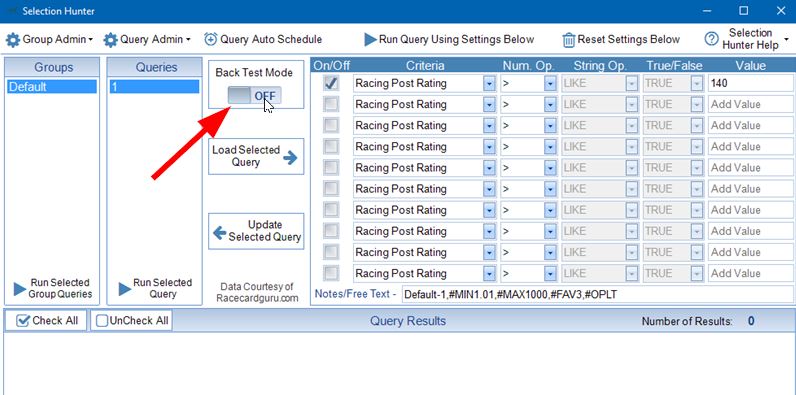
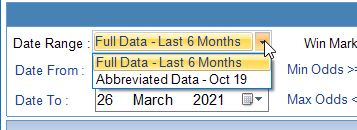
The screen layout will change slightly so that you can add further criteria such as odds ranges and favourite ranking. The default date range is a rolling 6 months worth of data. If you wish to go back further (currently October 2019) then you can change the date range drop down to only fetch abbreviated data. This allows you to back test up to 15,000 rows of data rather than the default 2000.
In the example below I have run very simple query.
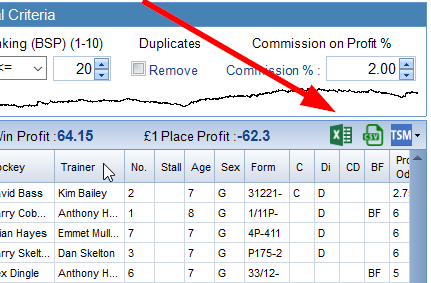
£1 Profit for Win and Place Market can be seen in the results. There is also a 'quick' graph showing the Win Market Cumulative Profit.
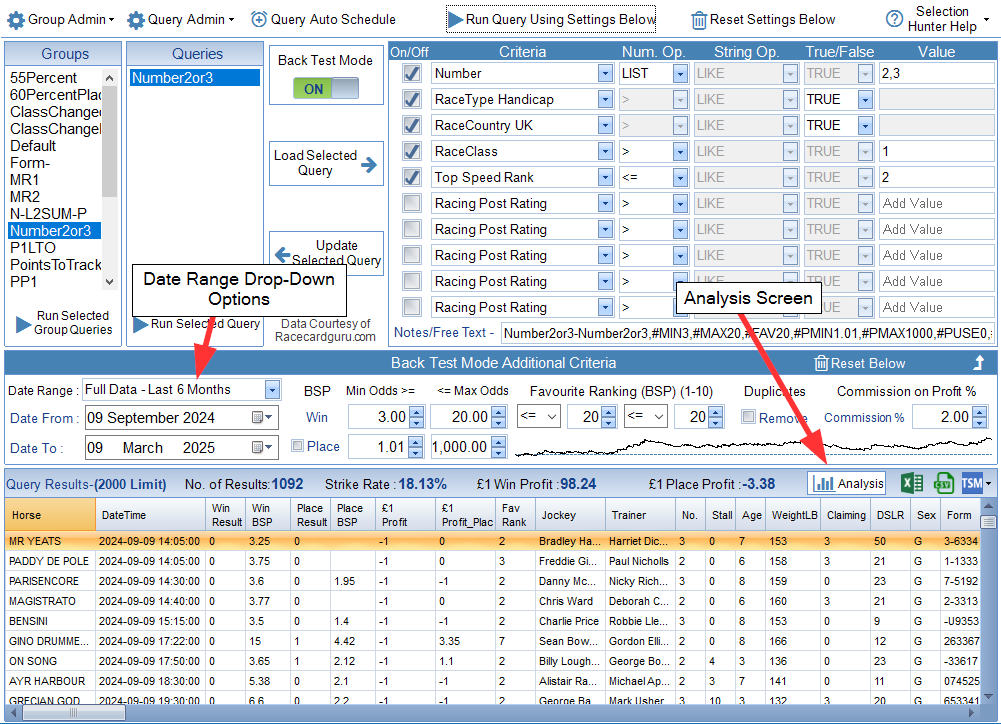
Additional Analysis Screen allows us to check the results if we had placed multiple selections as Dutch Bets. There is also additional options to filter on 1st Half, 2nd Half, Quarters, Even/Odd Days. There is also an option to breakdown the results by Course.
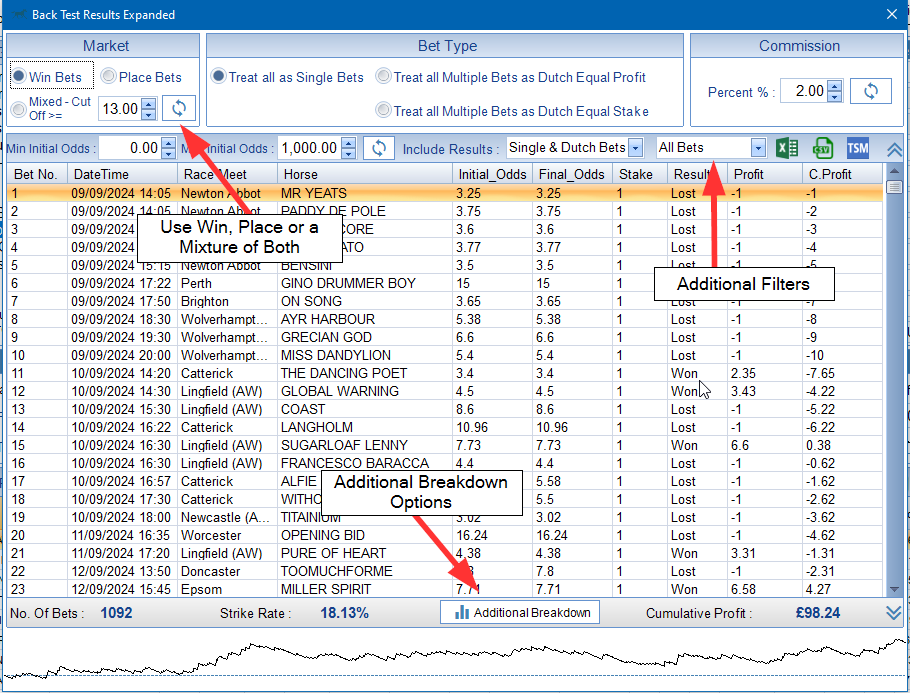
There are 2 Odds Columns. The first is the Initial Odds and the second is the Final Odds. These can be different when viewing Dutch Bets to Equal Stake and All Place Market Dutch Bets. The Initial Odds is the combined odds at the time of bet placement. When Dutching to Equal Stakes, we don't know the final odds until we have our results in when using Dutch to Equal Stakes.
Screenshot below highlights this -
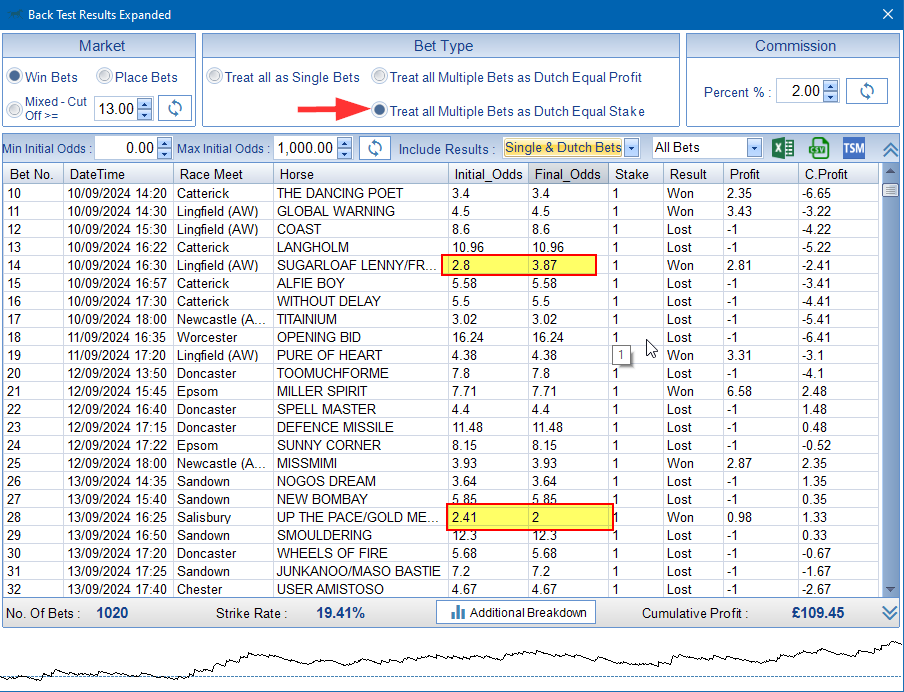
Same effect can be seen in the Place Market as we can get more than 1 winner. This will boost our initial odds. In reality we have no idea how many winners we are going to have when the bet is placed.
Hence we can only filter on Initial Odds.
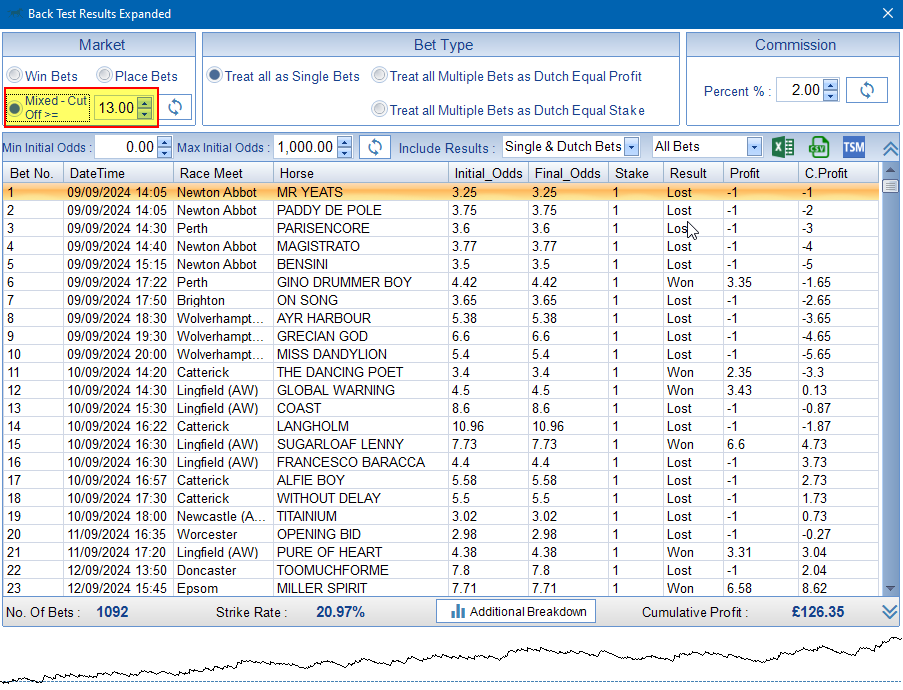
Added - 10/03/2025 - Ability to View a Mixture of Win and Place Bets (Horses Only at this time)- By using a cut off value we can use Win Bets until the odds hit our cut off value. In the screenshot below the cut off is 13. This means that all bets with win odds under 13 are shown as win bets. 13 or above are shown as Place Bets. This has the effect of increasing strike rate and profit in our example. To recreate this in TBM when automating bets we would set the Market Placement to match these settings.
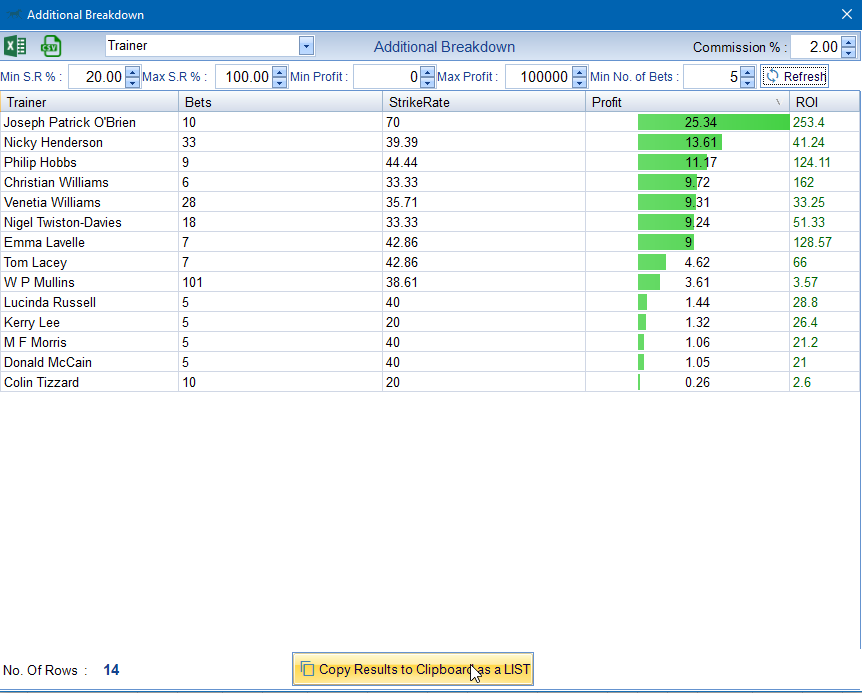
Breakdown by Course has since been replaced with 'Additional Breakdown' which brings up a separate screen as below - Use the drop down to choose from a selection of criteria to drill down on. When analysing dutch bets averages are used for ratings and rankings.
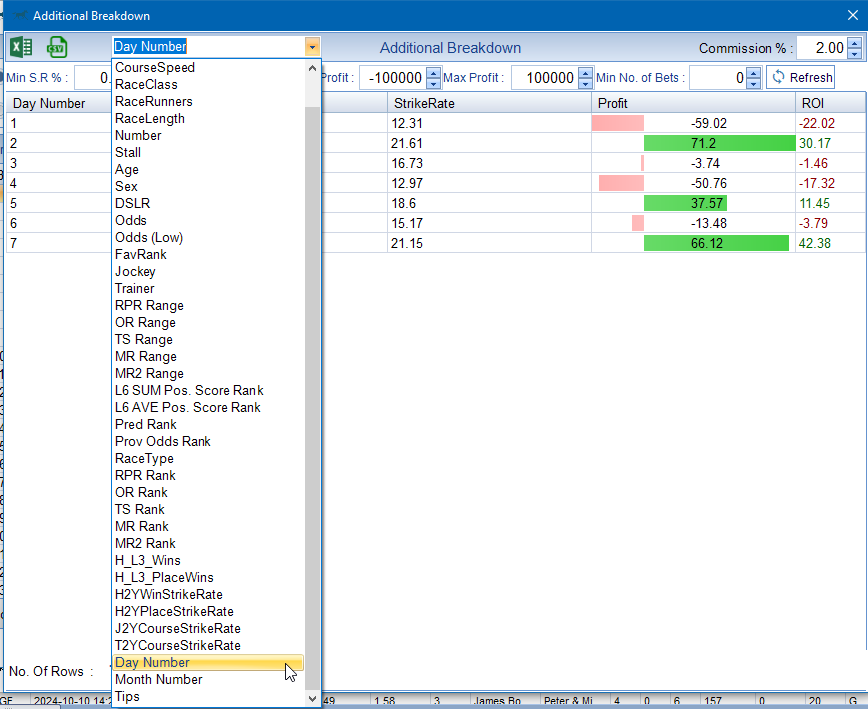
For Course, Jockey, Trainer, RaceRunners, RaceLength, Age, RaceClass, Stall, Number and RaceType there is the option of creating a LIST to be used as a 'Hot LIST'.
For RaceType bets will very often overlap several RaceTypes and will appear in more than 1 Category of RaceType.
The screenshot below show filters added to create a Trainer Hot List. If you press the 'Copy Results to Clipboard as a LIST' Button this will allow you to paste the Hot List back in the Selection Hunter Main screen.
There is a Tutorial as part of the How DO I ? Series covering the LIST feature. This can be found at How Do I Generate a LIST of best Performing Trainers in a System that I Have Designed ?
|
Maximum Selections that can be returned for all Groups/Queries when using full data is 2000. Maximum Selections that can be returned for all Groups/Queries when using abbreviated data is 15,000. |
|
Only Selections that have Win Odds and a known Result in the database are included in Back Test Results. All odds used are BSP. There is no guarantee that the data is 100% accurate. |
You can export your data to Excel, CSV or TSM via the main Back Test Screen OR through the Additional Analysis Screen.