How Do I Generate a LIST of best Performing Trainers in a System that I Have Designed ?
The LIST criteria option in Selection Hunter is exactly as described. It is LIST of possible values. Each value is separated by a comma. An example LIST is shown below where we have the TOP 7 Trainers over the last 7 days. This was on the 12/07/2022.
Joseph Patrick O’Brien,Mrs John Harrington,K R Burke,Gordon Elliott,Hughie Morrison,John Patrick Ryan,Roger Varian
So how do we obtain this list ?
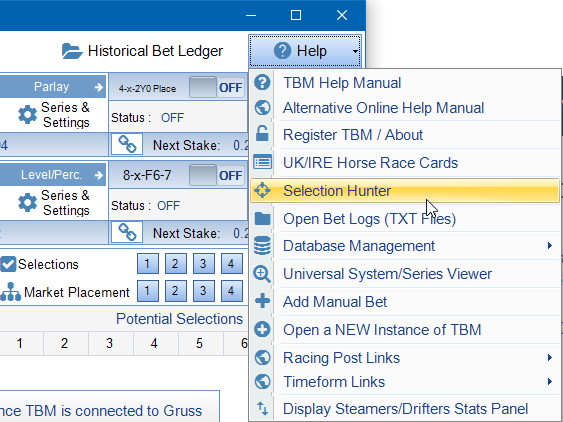
If we wanted to include all races with no filters we would use the Hot LIST Generator as covered in https://www.thebetmachine.com/how-do-i-use-the-hot-list-generator-in-selection-hunter/
If we wanted to fine tune a system we already have then we would use the Analysis Feature in Selection Hunter.
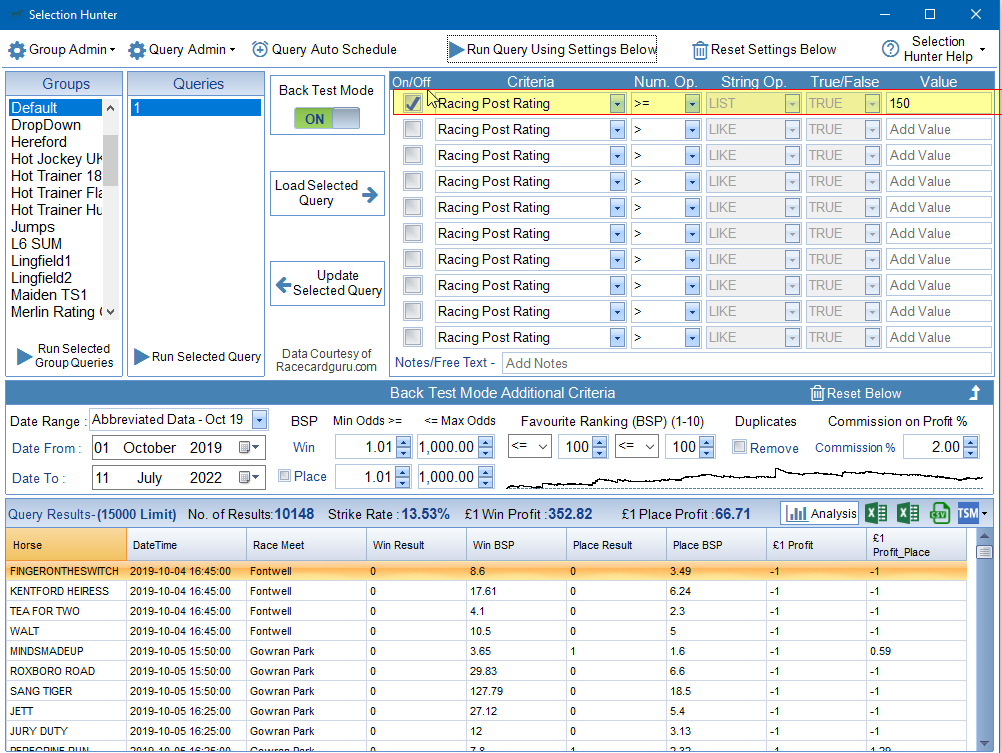
For this exercise we will just use a very simple system and go for all Horses with Racing Post Rating > 150 since the start of the data in October 2019.
This produces a data set of over 10,000 bets. We can see in the mini graph a couple of jumps where an outsider has won and pushed the profit up which we need to be aware of but as an example set this is fine to use. Press the ‘Analysis’ button just above the results data.

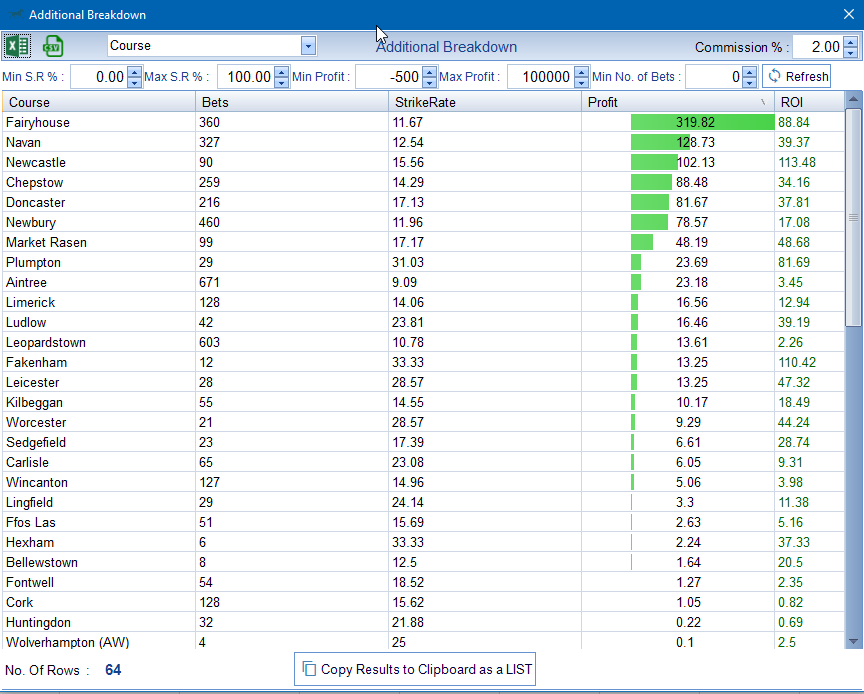
On this screen we could switch to Place/Dutch Bets to check how they perform. In this example I am looking at Single Win Bets. Press the ‘Additional Breakdown’ Button just above the mini graph.
At the top of the screen is a drop down list of criteria that can be broken down. Default is Race Course. In this example we are looking at Trainers. I am also going to add some filters. The aim is to obtain a list of the most consistent trainers over the course of the data set. I have set the minimum amount of bets at 20 and strike rate of 20%.

Now we have our List of Trainers we can add them to the system. Press the ‘Copy Results To Clipboard as a LIST’ button.
Then navigate back to the Selection Hunter Screen. We can paste the LIST straight in to the 2nd row Criteria Values. We can do this by right clicking over the values box and pressing ‘Paste’.
Tick the checkbox for the second row of criteria. Then set the criteria dropdown to ‘Trainer’ and set the String Operator to ‘LIST’.
Run the Query again and check the results.

We can see the strike rate has increased. There are also less jumps in the mini graph. We can fine tune this system and increase the strike rate if desired by adding a favourite ranking criteria. In the screenshot below I have set the Favourite Rank to <= 3.
We can see the strike rate has increased up to nearly 40%.
If we were spending a few hours on this we would check what happens if we created the LIST after reducing the favourite rank to 3. We would also use the Analysis Breakdown Screen to check for other criteria. Great ones to check are Class and Age. Some systems really do not work in the uber competitive races (Class 1). Similarly some systems do not work on the inexperienced horses (Age 2/3).
Word of Warning – Back fitting is when we use a set of criteria that produces a very specific set of results. When designing systems we try to have criteria that will produce the same type of results irrespective of the date range and sample size. The example above uses the entire data set in order to avoid back fitting however as we have used only 5 trainers there is STILL an element of back fitting. All systems created will have an element of back fitting in them. Once we have created a system we always need to play it out live for a month (paper trading) or so at test stakes in order to see if the future data does indeed match the historical data.


